To find unprofitable UCO pickup stops, score every stop on one line: the net value of the gallons you collected there, minus what it cost to reach and service it. A stop that comes out negative over a full cycle is losing money. Most losing stops are low-volume, far off the route cluster, or carry a rebate set when oil prices were higher. Fix them in order: re-space the visit, then charge a fee, and drop the account last. All numbers below were checked on November 6, 2026.
Disclosure: DynoRoute makes route planning software for used cooking oil (UCO) collectors. This guide names other tools where they fit.
Key Takeaways
- A UCO stop is unprofitable when its cost to serve (extra miles, minutes on site and its share of the offload run) is bigger than the net value of the oil it gives you.
- ATRI puts the average cost of running a truck at $2.336 per mile in 2025, so a stop that adds 22 miles costs about $51 in driving before anyone opens a container.
- Break-even gallons = cost per stop ÷ net margin per gallon. At an illustrative $1.50 net margin, a $42 stop needs about 28 gallons per visit.
- FoxInsights reports that once containers were monitored, its customers' pickups moved from a 30 to 100% fill spread to 80 to 90%, which is why re-spacing usually beats dropping.
- A customer yield report (actual gallons ÷ expected gallons per account) tells you whether a weak stop needs a longer gap, a fee or the exit.
What Makes a UCO Pickup Stop Unprofitable?
A UCO pickup stop is unprofitable when the money you make on its oil does not cover the cost of getting there and doing the work. The oil side is gallons collected times your net price per gallon, after any rebate you pay the restaurant. The cost side is the extra driving the stop adds, the minutes on site and its share of the trip to unload.
Five patterns cause most losing stops:
- Low volume: A 20-gallon stop still costs the full drive-in, hookup and paperwork time.
- Off-route distance: An isolated stop adds miles that clustered stops share. See the route density guide for how clustering changes cost per stop.
- A rebate that no longer fits: A rebate set when oil paid more can turn a positive stop negative. Re-score it against today's price.
- Contamination: Water and food waste lower what the processor pays for those gallons, and bad loads can become a disposal cost.
- Half-full containers: A fixed calendar sends the truck before the container is ready, so the same trip collects less.
How Do You Calculate Profit per UCO Stop?

Profit per UCO stop is the stop's net contribution. Use two formulas:
Net contribution = (gallons collected × net margin per gallon) − (extra miles × cost per mile) − (minutes on site × labor cost per minute)
Break-even gallons = cost per stop ÷ net margin per gallon
- Gallons collected: Use what the driver logged at the stop, not what the container could hold. Proof of the real number is covered in UCO pickup proof and weights.
- Net margin per gallon: What your buyer pays per gallon, minus any rebate. Prices are often quoted per pound. This guide uses 7.5 lb per gallon as a planning number; use your own measured weight if you have it.
- Extra miles: The miles this stop adds compared with skipping it, including the drive out and back to the cluster.
- Cost per mile: The ATRI 2026 Operational Costs of Trucking report puts the 2025 industry average at $2.336 per mile, or $1.854 per mile without fuel. It is a carrier-wide average for long-haul trucking, so treat it as a starting point and replace it with your own figure.
- Labor cost per minute: Your loaded driver cost for time on site.
Worked example: one stop, priced line by line
All inputs are illustrative. Say your buyer pays $0.30 per lb and you pay the restaurant $0.10 per lb. At 7.5 lb per gallon, that is $2.25 minus $0.75, a net margin of $1.50 per gallon. The business-analysis site bizbite.io models processors paying $0.20 to $0.50 per lb and collectors paying restaurants $0.10 to $0.20 per lb, so these inputs sit inside that range.
The stop adds 15 extra miles and takes 10 minutes on site at a loaded labor cost of $40 per hour.
- Driving: 15 × $2.336 = $35.04
- Time on site: 10 × $0.67 = $6.67
- Cost per stop: $41.71
- Break-even: $41.71 ÷ $1.50 = about 28 gallons per visit
If that stop gives you 25 gallons, it loses about $4 every visit.
Fuel is the part that moves fastest. The EIA's U.S. on-highway diesel average was $6.292 per gallon for the week of November 2, 2026. A truck getting an assumed 6 miles per gallon burns about 3.7 gallons of diesel on a 22-mile detour, roughly $23 in fuel alone. When diesel jumps, the stops just above break-even are the first to slip below it.
How Do You Find Unprofitable UCO Pickup Stops With a Scorecard?
The fastest way to find unprofitable UCO pickup stops is a scorecard that puts every account on one row, so the losing stops stand out. Score each stop over a full cycle, not one visit.
| Stop | Gallons per visit | Minutes on site | Extra miles | Oil value | Cost to serve | Net contribution | Next step |
|---|---|---|---|---|---|---|---|
| A (illustrative) | 150 | 15 | 1 | $225.00 | $12.34 | +$212.66 | Keep |
| B (illustrative) | 60 | 12 | 8 | $90.00 | $26.69 | +$63.31 | Keep, watch spacing |
| C (illustrative) | 25 | 10 | 15 | $37.50 | $41.71 | −$4.21 | Re-space the visit |
| D (illustrative) | 20 | 20 | 22 | $30.00 | $64.73 | −$34.73 | Fee, minimum or drop |
Method: sample figures. Net margin $1.50 per gallon, $2.336 per extra mile (ATRI 2025 average), $40 per hour loaded labor on site. Replace each rate with your own.
Stops C and D are the ones to work on. Stop C misses break-even by about 3 gallons, so a longer gap between visits likely fixes it. Stop D needs 43 gallons per visit to break even, so spacing alone may not be enough.
Why Can a Stop Look Profitable and Still Cost You?
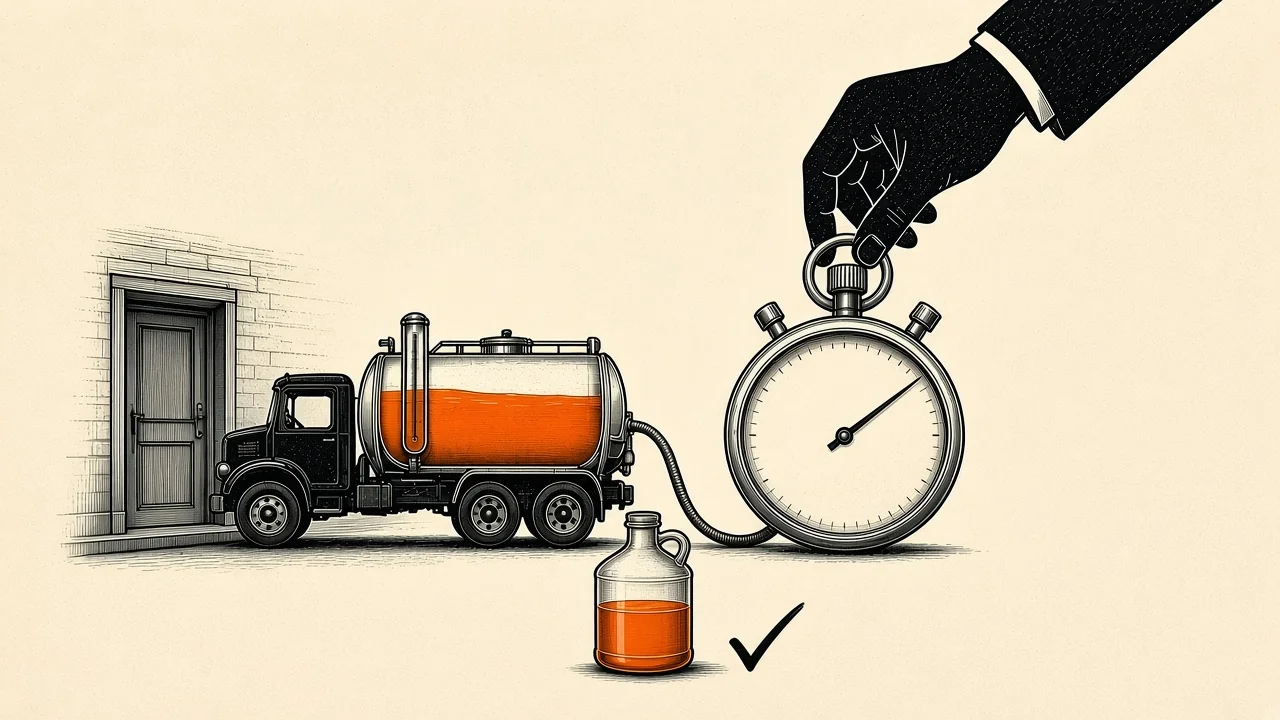
A stop can show a positive net contribution and still cost you money, because the per-stop test ignores the truck's tank. Every minute on a low-yield stop is a minute not spent filling the truck before the trip to unload. Add one more measure for stops late in the day:
Gallons per truck-hour = gallons collected ÷ (minutes on site + extra drive minutes + the stop's share of the offload run) × 60
Worked example: two stops on the same truck
All numbers are illustrative. The dispatcher plans to unload at 3,200 gallons, and the round trip to the receiving site takes 60 minutes. That spreads to about 0.019 offload minutes per gallon collected.
- Stop X: 20 gallons, 10 minutes on site, 20 extra drive minutes. About 30.4 minutes in total, or about 40 gallons per truck-hour.
- Stop Y: 120 gallons, 15 minutes on site, 5 extra drive minutes. About 22.3 minutes in total, or about 324 gallons per truck-hour.
At Stop X's rate, a 3,200-gallon load would take about 81 truck-hours. At Stop Y's rate it would take about 10. Late in the day, a 20-gallon stop that takes half an hour pushes the offload trip back and delays every high-yield stop after it. For how the offload trip fits into the day, see route planning with disposal stops. For how many stops a truck can handle in a shift, see how many stops per day a UCO truck can make.
Low-Volume UCO Customers: Drop, Consolidate or Charge a Fee?
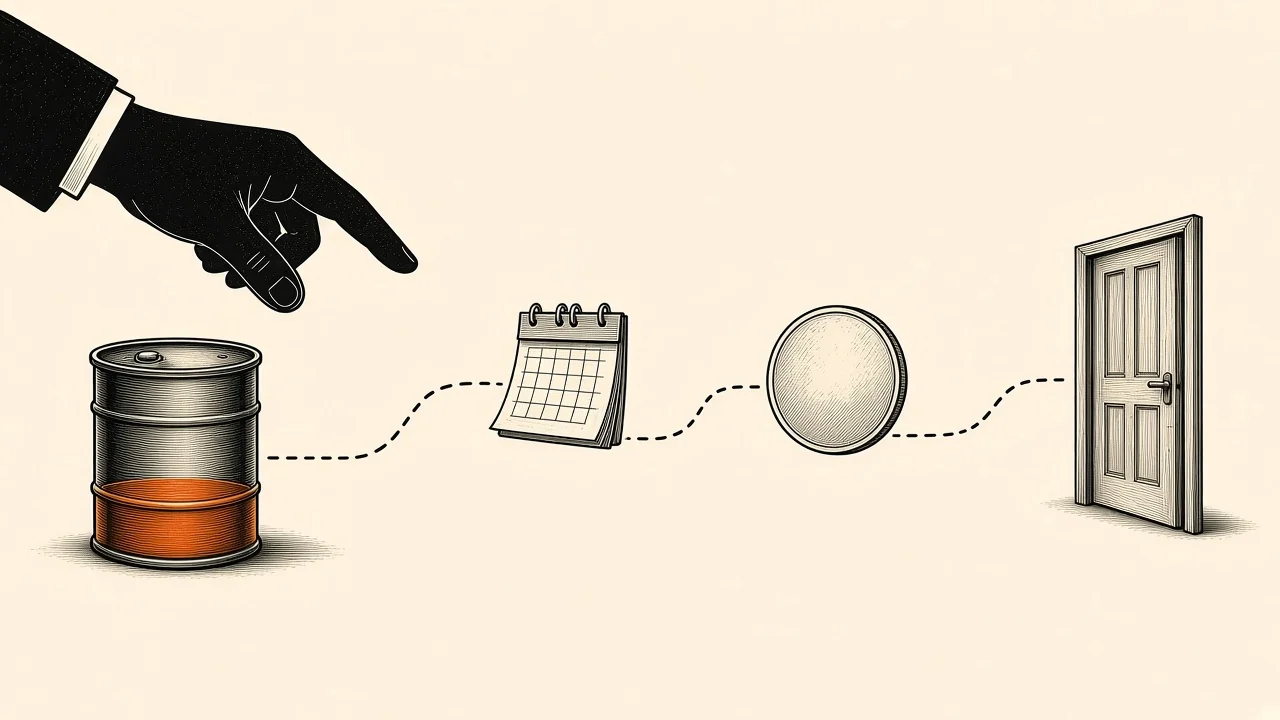
For low-volume UCO customers, consolidate first, charge second and drop last. Most weak stops are not bad accounts. They are good accounts visited too often.
| Option | When to use it | What the evidence says | Effect on the route |
|---|---|---|---|
| Re-space or go fill-triggered | The container is rarely full when the truck arrives | FoxInsights reports pickups moving from a 30 to 100% fill spread to 80 to 90% once containers were monitored. It says a trip to an 85% full container gives double the yield of one at 45%, for the same cost. | Fewer visits, more gallons per visit |
| Charge a fee | The stop stays below break-even even on a longer gap | bizbite.io models per-stop pickup fees of $50 to $150 and uses service fees to offset low-volume or high-contamination pickups. Oil Guyz, a California collector, says a small number of very low-volume or remote locations may see a nominal service fee. | Same visit, but the fee covers the gap |
| Set a minimum pickup | Partial pickups keep coming back light | Your own break-even gallons, from the formula above | Small stops wait until they are worth the trip |
| Drop | Net contribution is still negative after the steps above | Your own scorecard, not an industry cutoff | Frees truck time and tank room for denser stops |
FoxInsights' figures come from its own 2025 analysis of waste oil collectors using its sensors. They are vendor-reported, not an independent study. The same analysis reports 35% lower logistics costs, 11% more orders per tour and 7% more quantity per tour.
Before you drop: direct cost or overhead?
Some stops cover their direct cost but not their share of overhead such as insurance and office staff. Others lose money on direct cost alone.
- Loses on direct cost: Re-space, charge or drop.
- Covers direct cost, misses overhead: Dropping it usually makes total profit worse. The overhead stays and the contribution goes.
- Container size: A larger container lets a low-volume account go longer between visits, where the site has room. A container that never fills may be too big for the account.
For how to set the visit gap from fill rate, see UCO route scheduling and fill cycles.
What Is a UCO Customer Yield Report?

A UCO customer yield report compares the gallons actually collected per pickup with the gallons you expected, account by account. It is not a standard published document. Collectors build their own, one row per account per cycle.
- Expected gallons: What the account should produce between visits, from its pickup history.
- Actual gallons: What the driver logged at the stop.
- Yield %: Actual ÷ expected × 100. Keep the history, not only the last visit.
- Next-visit spacing: Low yield means the container was not ready, so lengthen the gap. Yield above 100% means the account fills faster than planned, so shorten the gap before it overflows.
| Account | Expected gallons | Actual gallons | Yield % | Next-visit spacing |
|---|---|---|---|---|
| 1 (sample) | 100 | 95 | 95% | Keep weekly |
| 2 (sample) | 80 | 40 | 50% | Move to biweekly |
| 3 (sample) | 60 | 15 | 25% | Monthly or on-call |
| 4 (sample) | 50 | 70 | 140% | Shorten the gap and check container size |
A yield that drops suddenly at one account can also mean oil is going missing. Container tracking helps you tell a slow account from a problem one.
How Do You Track Stop Profitability?

You need three things: the actual gallons at every stop, the miles and minutes each stop adds, and your current price and rebate terms.
- Spreadsheet: Works for a few dozen accounts if drivers log real gallons and times. It breaks down when the route changes daily.
- Fill-level sensors: Products like FoxInsights read the customer's container level each day, so you visit when there is oil. They measure the container, not your truck or your margin.
- UCO collection software: Route Simplified (Reiter Software) describes fill rate tracking and route optimization for UCO collectors. Its Local plan is $100 per month plus $1 per account for up to 500 accounts, with a one-month free trial (checked November 6, 2026).
- DynoRoute: Plans restaurant pickups around expected gallons, truck capacity and offload returns. You set each truck's capacity in gallons, pounds, or the unit your operation uses, and the route re-plans when actual gallons change the day. Recurring pickups can be weekly, biweekly, monthly or custom, so a weak account can move to a longer cycle instead of being dropped. The driver app captures actual quantities with timestamped, geotagged photos. Missed- and skipped-stop reports, service-history reports and data exports give you the inputs for the scorecard.
Where DynoRoute stops: it stores account terms, price references, quantities and quality notes, but it is not a commodity-settlement engine. It does not set your rebates or decide which accounts to drop. That call stays with you and the scorecard. For how assignments are made day to day, see dispatching UCO collection trucks.
Frequently Asked Questions
How do you find unprofitable UCO pickup stops?
Score each stop over a full cycle as gallons times net margin per gallon, minus extra miles times cost per mile, minus minutes on site times labor cost. Any stop that stays negative is unprofitable. Start with stops that are both low-volume and far off the route cluster.
What is cost per stop on a UCO route?
Cost per stop is what one pickup costs you: the extra miles it adds, time on site and its share of the offload trip. ATRI's 2025 average of $2.336 per mile means a stop that adds 15 miles costs about $35 in driving alone. Add your labor cost for time on site.
How many gallons does a UCO stop need to break even?
Divide the stop's cost to serve by your net margin per gallon. A $41.71 stop at a $1.50 net margin needs about 28 gallons per visit. Both numbers are illustrative, so use your own price, rebate and cost per mile.
Should I drop low-volume UCO customers?
Usually not first. Move them to a longer or fill-triggered gap, then add a fee or minimum pickup, and drop only if the stop still loses money. A stop that covers its direct cost but not overhead usually makes you more money kept than dropped.
What is a UCO customer yield report?
It compares actual gallons collected with expected gallons for each account, as a yield percentage. Low yield means the container was not ready, so lengthen the gap. Yield over 100% means the account fills faster than planned, so shorten it.
What should a driver record at each UCO stop?
Record actual gallons collected, minutes on site and any contamination or access problem. Note whether the container was full or partly full. Averaged over several visits, these give you net contribution and yield for every account.
Does diesel price change which stops are profitable?
EIA's U.S. diesel average was $6.292 per gallon for the week of November 2, 2026, so a 22-mile detour at an assumed 6 mpg burns about $23 in fuel. Stops just above break-even are the first to turn negative when diesel rises.
Book a 30-Minute Intro Call
Want to see your own routes planned around expected gallons, truck capacity and the offload return? Book a 30-minute intro call and bring one route's stop list. We will walk through how it would run in DynoRoute. See what else is built for UCO collectors on the used cooking oil software page.