Key takeaways
- Restaurant-facing guides put used cooking oil pickup frequency at weekly to monthly, which tells one kitchen what to expect but says nothing about setting intervals across a whole book of accounts.
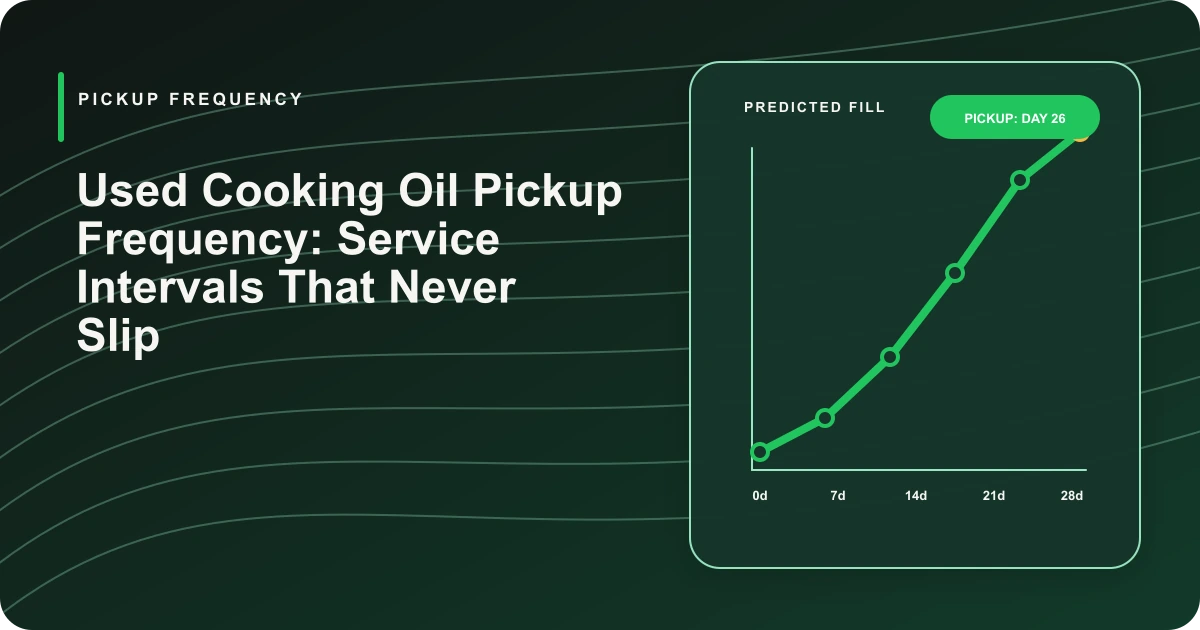
- Each container can carry its own service date once you forecast its daily fill from measured pickups and step back from the threshold date by an uncertainty buffer.
- Fixed cadences suit steady, contract-bound accounts, while fill-triggered service pays on accounts whose volumes swing, so the choice is made per account rather than fleet-wide.
- Servicing a container early is rational when the extra corridor time costs less than the standalone trip it prevents and the truck still has room afterward.
- A dead sensor or a sudden volume drop calls for a conservative fallback and a diagnosis, never a skipped service.
Nearly everything written about used cooking oil pickup frequency is advice for restaurants: what one kitchen with one container should expect from its collector. You sit on the other side of that arrangement, setting service intervals across hundreds of containers that fill at wildly different speeds. I build DynoRoute, routing and dispatch software for fleets that fill up as they work, used cooking oil collectors among them — pricing is public — and most of what follows comes from a year spent interviewing the operators who set these schedules. The method that scales is per-container arithmetic: forecast each container's daily fill from measured pickups, compute the latest date you can safely arrive, and let those dates drive which containers make each cycle's route and which truck absorbs the mid-week surprises. Set an interval too long and a container overflows; too short and your trucks burn hours pumping quarter-full boxes.
Vendor numbers below are labeled as vendor-reported, and when an example is illustrative rather than sourced, I say so.
How often should used cooking oil containers be picked up?
Used cooking oil collection typically runs weekly to monthly, depending on how much oil the kitchen generates. That range comes from RTI's rendering-tank guidance, and the industry's restaurant-facing guides fill in the detail: RTI's own deep-fryer frequency guide puts busy quick-service kitchens at multiple pickups per week and full-service restaurants at weekly or biweekly, Start Green tells cafés monthly is often enough, and Mahoney Environmental sets a floor of once every two months for slow kitchens.
Now notice who all of that advice addresses. From Start Green's FAQ to Grease Connections' scheduling guide for New Jersey kitchens, every page answers a restaurant asking how often to book its own pickup, and answers it well. The collector's version of the question is different, and none of those pages touch it: how do you set frequencies across hundreds of accounts at once, so that no container overflows and no truck spends its day on stops that yield, say, fifteen gallons? FoxInsights, writing for collectors, supplies the reason a single answer fails: a busy kitchen can fill a container in a few days, while a seasonal venue might take six months. Weekly-to-monthly is a true statement about the middle of that spread. Your account list lives across all of it.
When is each container actually due? The latest-safe-date math
A container's service date falls out of three numbers: how fast it fills, how full you allow it to get, and how much you trust your estimate. The fill rate comes from measurement: forecast daily fill = change in verified volume ÷ days between measurements. Verified is the word doing the work, and it asks for nothing you do not already collect: the gallons you meter at every pickup are the measurement, so two serviced visits give any account a working fill rate. For accounts with no history at all, the next section covers starting from zero.
From there, latest safe service date = today + (safe threshold − current estimate) ÷ forecast daily fill − uncertainty buffer. The buffer covers what the forecast cannot know: a hot week at the fryers, or a dip reading taken while the oil was still moving. Size it from your own record of forecast misses on the account, not from a universal number.
Illustrative numbers, not a customer's: a fried-chicken operation runs a 200-gallon container with a threshold of 150 gallons. The last pickup metered 126 gallons, 21 days after the previous visit emptied the container, so it fills about 6 gallons a day. Fourteen days later the estimate stands at 84 gallons; (150 − 84) ÷ 6 gives 11 days, and a three-day buffer puts the latest safe date 8 days out. Any route through that corridor inside the next week can carry the stop; past day eight, the account forces a dedicated trip.
Where does the threshold come from? Two unrelated sources land on nearly the same number: Grease Connections tells kitchens the sweet spot is a pickup around 70 percent full, and a smart-container framework published in Interciencia proposed collection alerts at about 75 percent of capacity. The Interciencia figure is a research proposal for sensor-equipped containers, not an industry standard, but the convergence makes a useful default: plan to arrive around three-quarters full, and treat anything past that as borrowed time.
How do you forecast accounts that have no sensors?
With history, use arithmetic; without history, use the venue; and in both cases wrap the number in a conservative band. Most containers in most UCO fleets carry no sensor, so this is where the method earns its keep.
The account's own measured pickups outrank everything else. Two give you a fill rate, and five or six start to show the account's rhythm. Until that history exists, start from what the kitchen is. The bands below fold the restaurant-facing guidance cited above into starting points — defaults to test against your first measured pickups, not fleet law:
| Account with no history yet | Starting interval to assign |
|---|---|
| High-volume quick service: fried chicken, burgers, donuts | Weekly to start, tightened fast if the first cycles run hot |
| Full-service restaurant | Weekly to biweekly |
| Café, coffee shop, small caterer | Monthly |
| Seasonal or event venue | Forecast per season, and never let the gap pass two months |
Season then scales the band. A shore restaurant in July and the same restaurant in February are effectively two different accounts. Date-stamp every measured pickup, and once an account holds a year of history, compare like months rather than adjacent ones.
New accounts start deliberately tight. An early light pickup costs you one modest stop; a late overflow can cost you the account. Book the first interval shorter than the venue band suggests, and let the account graduate to its own fill rate after two measured visits.
Fixed cadence or fill trigger: which accounts get which?
Neither wins fleet-wide; you choose per account based on how much the volume swings and what a surprise would cost. A fixed cadence, the same container every second Tuesday, is cheap to plan, builds a driver rhythm, and gives the kitchen a pickup day its staff can work around. The price of fixed cadence is drift: the calendar keeps a steady beat while the fryers do not, so the route quietly accumulates stops that are either too early or too late.
A fill-trigger schedule services each container when your forecast for it, or a third-party sensor reading where an account carries one, says the threshold is approaching. The prize is fewer wasted stops and fuller containers at pickup. UCOFox, FoxInsights' sensor product, reports 40 percent longer collection intervals, 35 percent fewer collection tours, and 25 percent more fill per pickup in a representative deployment; those are the vendor's own numbers, published with its own disclaimer that results vary by portfolio and density. Directionally they describe the prize correctly, because every skipped quarter-full stop is truck time handed back to the fleet.
No independent US study compares the total cost of fixed versus triggered UCO scheduling; I looked. So the choice stays a judgment call, and it is worth noticing that the industry's own practice already leans hybrid. G.A. Wintzer, an Ohio renderer, tells its accounts it will set up service based on usage while keeping a phone line open for extra pickups, which is a fixed rhythm with a trigger valve on top. Run the same hybrid deliberately: steady, contract-bound accounts keep their cadence; high-volume accounts that swing get the latest-safe-date treatment recomputed at every pickup; and slow accounts attach to whatever day a truck already works their area.
When does an early pickup make sense?
Service a container early when the incremental corridor cost is less than the avoided cost of a later standalone trip, and the truck still has useful capacity after the stop. Early pickups feel like a failure of scheduling discipline; often they are the cheapest gallons on the route.
An illustrative case: a container sits at 55 percent, ten days from threshold, four minutes off a route your truck runs tomorrow. Left alone, it matures into a standalone trip across town next week, call it forty minutes of truck time. Taken tomorrow, it costs eight minutes of corridor time and roughly 110 gallons of tank space. If the truck ends the day with capacity to spare, taking it early is plainly right; if carrying those gallons forces an extra depot return, the standalone trip was cheaper all along. Early pickups do pull your average fill per stop back down, which is the tension with the fill-trigger logic above; that is why the rule prices the corridor instead of declaring a policy.
What do you do when telemetry fails or volume suddenly drops?
Fall back to arithmetic, never to nothing. When a sensor-equipped account goes dark, schedule from the last reliable reading advanced at a deliberately conservative fill rate, the high end of what that account has ever shown. An outage should shorten the interval, not stretch it: less certainty means arriving earlier, because the failure mode of early is a light stop and the failure mode of late is oil on the ground.
A sudden volume drop is a different problem. The forecast said 150 gallons and the driver pumps 40. Before that number touches the schedule it needs a diagnosis, because the candidates are nothing alike: theft, a leak, an unrecorded container swap, a misread gauge, or a kitchen that genuinely slowed down. We walk the theft branch of that diagnosis, gallons math included, in used cooking oil theft prevention, and the custody discipline that rules a swap in or out lives in our guide to container tracking. Whatever the cause, quarantine the anomaly: a poisoned interval must never enter the fill-rate math, or the schedule learns the wrong speed and the container overflows a cycle later.
Recalibrate the frequency after every measured pickup
The schedule is a model of your accounts, and every pickup is a free measurement to correct it against. Collected gallons divided by days since last service updates the fill rate; two consecutive light pickups argue for stretching the interval; arrivals that keep landing at or past threshold argue for tightening it, or for a bigger box. Moving a hot account up a container size (Wintzer's restaurant lineup runs 55 to 280 gallons) can turn a weekly scramble into a comfortable biweekly without touching the route. Recalibration is a few minutes of desk work per cycle, and it is the difference between a schedule that slips a little more each month and one that tracks its accounts.
Keeping hundreds of service intervals in one system
None of this needs software at ten accounts; a spreadsheet holds it. What breaks the spreadsheet is that every account carries its own fill rate, threshold, band, and next date, and every completed route changes several of them at once. We built DynoRoute to carry that bookkeeping. Recurring schedules hold each account's cadence, weekly, biweekly, or monthly, without slipping when the calendar gets crowded. Per-stop records with custom fields keep the container size, threshold, and last measured gallons attached to the account, where your forecasts can reach them. Routes are planned against each truck's fill limit, and the AI dispatcher places surprise insertions on the right truck with a confidence score. Drivers attach timestamped, geotagged photo proof at every stop, so each pickup leaves behind the measured record recalibration depends on, and your existing account list arrives by CSV import. To be plain about the division of labor: the formulas in this guide are yours to run — or to hand to an agent you set up in DynoRoute, one that holds each account's threshold, recomputes the latest-safe date after every verified pickup, and flags accounts drifting toward overflow; what the software contributes is that every number they depend on gets captured once, at the stop, and never lost.
If your service intervals still live in a spreadsheet that slips a little every busy week, tell us what your fleet collects and how your accounts are spread, and set next cycle's dates from the containers instead of the calendar.