Key takeaways
- There is no universal number of porta potties one truck can service in a day, because the real answer is the smallest of three limits: what the waste tank can take, what the fresh-water tank can give, and what the clock allows.
- Many portable restroom service trucks pair waste and fresh-water compartments, so waste fills on one side while fresh water drains from the other, and either side can end the route first.
- Current PSAI standards separate workplaces from general public use: ANSI/PSAI Z4.3-2025 and Z4.4-2025. Use the adopted text for the applicable scope, not the superseded 2024 revision draft.
- Units, stops, and sites are three different counts, and a plan that tracks only one of them misjudges every multi-unit construction route.
- The 40-to-50-units-a-day figure that circulates in this industry has no authoritative source behind it, so the only benchmark worth planning on is the one built from your own completed routes.
Ask how many porta potties one truck can service in a day and you will hear a wide range of confident answers. Each belongs to a particular truck, crew, service method, and route mix. The ceiling comes from capacity and time, which is why service cadence, mixed-job dispatch, and routes for trucks that fill up as they work have to use the same assumptions. I build DynoRoute, routing and dispatch software for capacity-constrained fleets, including porta potty route software. What follows is the math: which limit ends the day, how to forecast gallons per unit, and how to build an operator-owned planning value.
One note before the math starts: figures with a source are linked and dated in place. Every other number in this article is illustrative, meaning round values chosen to show the mechanics, not benchmarks from any real fleet.
Which limit ends the day first?
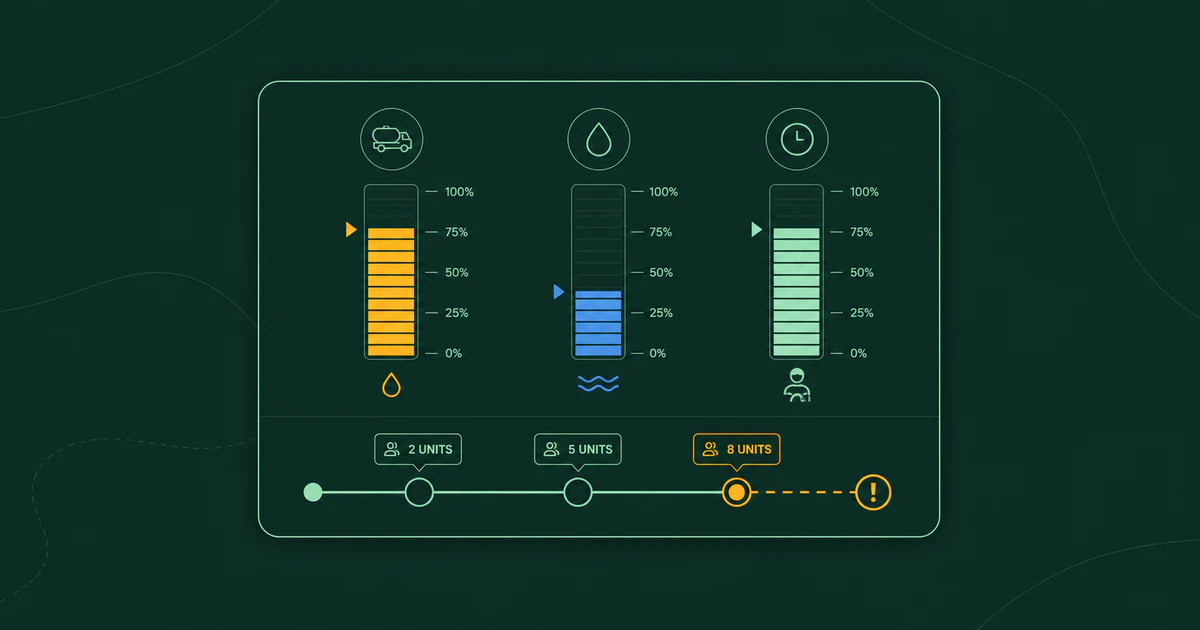
A porta-potty service day ends when the first of three limits hits: the waste tank is full, the fresh-water tank is empty, or the shift runs out of minutes. Which one hits first changes with the route mix, so the same truck can be waste-limited on Saturday's event pullout and time-limited on Monday's scattered singles.
Paired waste and fresh-water compartments make this a two-meter problem: every service pumps waste into one side and draws fresh water for rinsing, recharging, or hand-wash refills. Matthews Motors, a builder of portable sanitation trucks since 1999, lists one build as a 750-gallon waste tank paired with a 350-gallon fresh-water tank. The same builder says that setup usually supports about 100 toilets on a route under normal usage. That is the manufacturer's general claim about a configuration, not a promise about your route, payload, or clock.
The planning form is short to write and demanding to feed: planned units for the day = the smallest feasible value from the waste, water, and time limits, where waste-limited units = usable waste capacity ÷ forecast gallons pumped per unit, water-limited units = usable fresh capacity ÷ forecast fresh-water gallons per service, and time-limited units = minutes available for unit service ÷ forecast service minutes per unit. Round down and then test indivisible stops, site overhead, time windows, access, legal payload, and shift feasibility.
Two inputs hide judgment calls. Usable capacity is the governing legal and physical limit minus an operator-set reserve for slosh, foam, measurement error, and load variance. Size that reserve from completed-load error instead of applying one percentage everywhere. Minutes available for unit service = governing work window − drive − site-access overhead − disposal or refill resets − yard work − inspections − fueling − breaks − administration − closeout. Use measured categories rather than a residual guess. Building reset time into the plan is covered in route planning with disposal stops. Consumables remain additional restockable constraints.
How many gallons does each unit actually take?
Gallons per unit is a forecast, not a spec. What a service pulls out of a given unit depends on the service interval, how hard the site uses it, and the unit type; the unit's tank size only sets the ceiling.
PSAI announced ANSI approval in April 2025 of ANSI/PSAI Z4.3-2025 for nonsewered systems at places of employment and ANSI/PSAI Z4.4-2025 for general public use. PSAI's current standards page summarizes the separate scopes and directs readers to the adopted texts. The superseded 2024 revision draft is not a current source for numeric service or tank-condition thresholds. Obtain the applicable standard and check the contract and federal, state, and local rules before setting service or compliance limits.
The route still needs its own measurements. The 8-, 10-, 18-, and 20-gallon pulls used below are illustrative inputs, not claims about an average unit or a standard trigger. The fresh side has its own forecast because service may include rinsing, recharging the holding tank, or refilling hand-wash stations, depending on the unit and contract.
You do not necessarily need a meter on every unit. If the receiving ticket records volume, divide discharged gallons by the units serviced on that load. If it records only weight or a flat fee, use a calibrated tank reading or another documented volume estimate instead. Track the result by route type and season; after enough comparable loads, the route has a gallons-per-unit distribution grounded in its own sites.
The table below runs the mechanism on one truck using illustrative usable limits of 675 waste gallons and 315 fresh gallons on a 10-hour day. Those limits are example inputs, not a recommended percentage of the 750/350 build above. All three route mixes are illustrative.
| Route mix (illustrative) | Waste-limited | Water-limited | Time-limited | What ends the day |
|---|---|---|---|---|
| Construction route with hand-wash stations: 10 gal pulled and 7 fresh gal used per unit, 8 min per unit, 440 service minutes | 67 units | 45 units | 55 units | Fresh water, at 45 units |
| Scattered single units: 10 gal pulled and 4 fresh gal per unit, 12 min per unit, 360 service minutes after the longer drives | 67 units | 78 units | 30 units | The clock, at 30 units |
| Illustrative high-yield event route: 18 gal pulled and 5 fresh gal per unit, 8 min per unit, 440 service minutes | 37 units | 63 units | 55 units | The waste tank, at 37 units |
The same truck produces three different days, each ended by a different limit, which is why a units-per-day number quoted without its route mix attached tells you nothing. The interval side of this forecast, meaning who sits on weekly cadence and which sites are creeping past their use counts, is its own discipline; I cover it in porta-potty service scheduling.
Units, stops, or sites: which number should you plan with?
Track all three, because they answer different questions. Units per day measures tank throughput. Stops per day measures the drive plan. Sites per day measures customer coverage. On a route where every stop is a single unit the three numbers collapse into one; on construction work they never do.
Construction makes multi-unit stops structural. OSHA's construction sanitation rule, 29 CFR 1926.51, scales facilities with headcount: one toilet for sites of 20 or fewer workers, a toilet seat and a urinal per 40 workers, and per 50 workers once a site reaches 200. A site with 160 workers is a bank of units at one gate, serviced back to back off a single stop and drive. OSHA's table sets fixture availability, not the service interval; construction cadence must follow the current Z4.3 standard, applicable rules and contracts, plus measured condition and actual use.
What ties the three counts together is minutes, and minutes deserve their own ledger with four lines. Service minutes at the unit. Drive minutes between sites, which is where route density quietly decides more of your day than any tank does. Access minutes: the locked gate, the mud, the unit a crew dragged to the far corner of the site since last week, a problem that grows until you track where every unit actually sits. And exception minutes for repairs, tip-overs, and graffiti. A driver who serviced 38 units did not necessarily have a slower day than one who serviced 60; read the four ledgers before comparing them.
Can this day absorb an event add-on or a delivery?
Only if the truck that takes it still clears all three limits afterward. An add-on is not one more stop; it is a withdrawal from three accounts at once, and sometimes from a fourth.
Event work can be demanding because concentrated use may produce higher pulls than a routine route. Using the illustrative 18-to-20-gallon inputs above, a same-day request to service six units would draw roughly 108 to 120 gallons of waste headroom, plus fresh water and travel and service time. Replace those inputs with measured event history. Deliveries and pickups spend carrier slots, payload, and minutes even when little liquid moves. The full mix must be checked as a coupled plan rather than squeezed in by stop count.
DynoRoute documents capacity and workload inputs, live job status, AI assignment recommendations using capacity, location, availability, workload, travel time, and other constraints, plus conflict checks. Those features can support same-day reassignment, but separate waste, fresh-water, and carrier-slot constraints—and how completed quantities update them—must be configured and demonstrated. The recommendation is only as current as the inputs feeding it. The wider playbook is in dispatching porta-potty service routes.
Replacing the 40-to-50 rule with your own benchmark
The 40-to-50-units-a-day figure gets repeated in this industry as if somebody measured it, and I could not find an authoritative source that did. It is not in the PSAI standard, not in any regulation, not in any study I could verify. It survives because it is round and easy to say, and it fails as a plan for the reason the table above shows: the same truck legitimately produces a 30-unit day and a 55-unit day in the same week.
Your completed routes contain the replacement. For every route-day, log units serviced, stops made, sites visited, measured load or discharge, fresh-water use where relevant, service minutes, drive minutes, access and reset time, and exceptions. Group comparable days and choose a planning percentile that matches the service risk and forecast quality; using a value achieved on three out of four days is only an illustrative 75% policy, not a universal standard. Keep separate distributions for construction, scattered-single, and event work, and recalculate after material changes in season, equipment, crew, process, or disposal network. Use enough observations to cover the variation you expect rather than assuming one month is always sufficient.
Plan the day around the limit, not the folklore
A notebook and documented load readings can build the benchmark. Whatever system you evaluate should demonstrate separate waste, fresh-water, carrier-slot, payload, and time constraints; scheduled disposal and refill resets; recurring visits; and day-of reassessment. DynoRoute documents generic capacity and workload inputs, recurring jobs and visits, AI recommendations, conflict checks, live status, and re-optimization. Test multi-dimensional capacity, unit conversion, reset insertion, and reset actuals end to end before relying on them for this three-limit model. Pricing is published at $199, $499, and $999 on the pricing page, with included optimization credits and technician caps and no per-seat pricing.
If your dispatcher is carrying the divided-tank math in their head, book an intro call and plan next week against your limits instead of somebody else's folklore.