Key takeaways
- Route density is productive work per truck-hour or truck-mile: stops per route-hour and stops per route-mile. Its money companion — revenue or contribution per route-hour — is not a density measure; it is a calculation you run from your own revenue and cost records over the same route hours.
- Pick the measure by trade: cart routes watch stops per hour and mile; pump-out and roll-off work should watch contribution per route-hour, because stop revenue and service times vary too much for stop counts alone.
- Calculate from door-to-door numbers (yard out to yard in) or the metric flatters you.
- Two routes with identical stop counts can earn very different money: service duration, drive time between stops, disposal trips, and revenue mix do the separating.
- An off-route account is an arithmetic question: the extra drive, service time, and disposal cost against the revenue. Corridor stops are cheap to add; satellite stops rarely are.
- Residential benchmarks like 180–220 carts per hour are consultant figures for automated curbside; never import them into pump-out work.
- Density gains only count if misses, overtime, pack-out, safety, and service quality hold steady. A denser route that creates callbacks is a net loss.
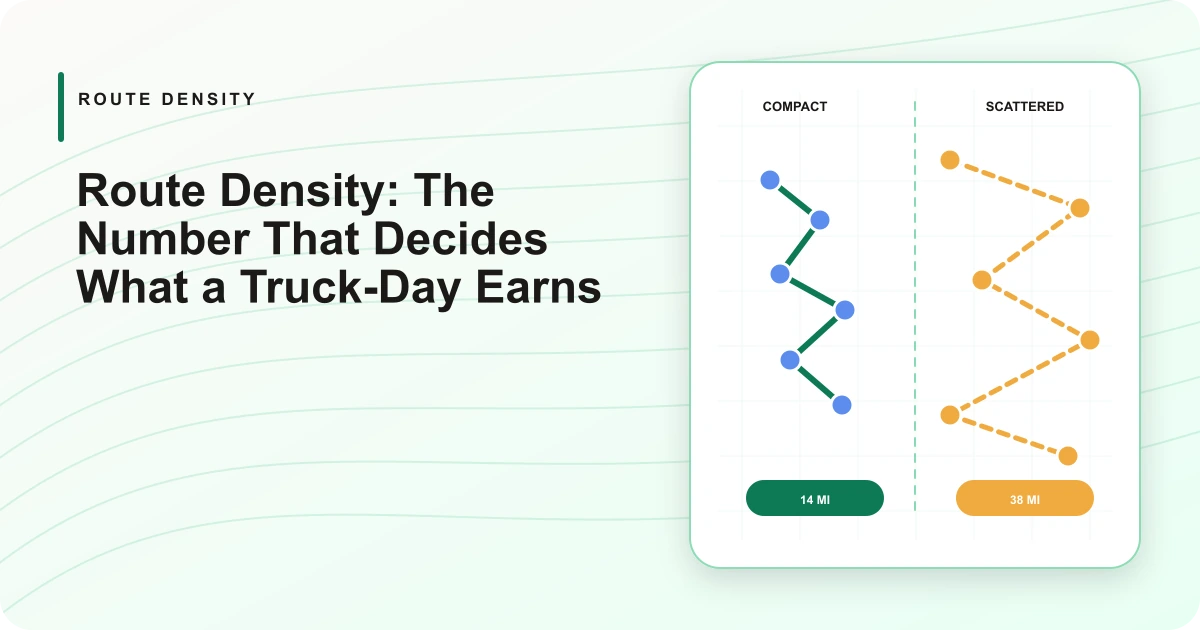
Route density is how much productive work a truck-day produces per hour or per mile: stops per route-hour and stops per route-mile. The number that decides decisions — revenue or contribution per route-hour — is not density itself but a calculation you run from your own revenue and cost records over the same route hours. I build DynoRoute, route planning software for waste and liquid-waste fleets (pricing is public), and density is the lever I see operators leave unpulled most often. Fit more billable work into the same truck-day and every cost under that truck (driver, fuel, insurance, payments) gets divided by more revenue. The lever matters because how many stops fit a truck is capped by capacity and the clock, so the recoverable waste is almost always the drive time between stops — the miles that bill nobody. Density is where route optimization turns into money.
If you run collection trucks, you already feel low density without a number for it: two trucks with the same stop count where one gets home at 3:30 and the other needs overtime, or a "full day" that somehow bills half of what Tuesday does. When I ask operators what a route earns per hour, the honest answer is usually that nobody has done the division. This article is that division.
What route density actually measures
Route density is productive stops divided by the truck-day that produced them. The two route measures:
stops per route-hour = completed stops ÷ door-to-door route hours
stops per route-mile = completed stops ÷ route miles
The money companion is not a density measure at all — it is a calculation you run yourself, your own billing records divided over the same hours:
revenue per route-hour = route revenue ÷ door-to-door route hours
Door-to-door means yard out to yard in. Counting only "time at stops" hides the exact waste you are trying to see: the drive between stops, the deadhead to the territory, the disposal loop. The same goes for miles: total route miles, not miles between billable stops.
The money formula has a sharper version. When your stops carry different disposal or material costs (a septic job whose dump fee runs a tenth of the ticket, a roll-off pull whose tipping fee runs half), swap revenue for contribution: revenue minus the direct costs that ride with the stop. Two routes can match on revenue per hour and diverge hard on contribution per hour, and contribution is the one your books feel. Your accounting stays your accounting; the route side of the division — hours, miles, stops — is what your dispatch records already hold.
Pick the measure that matches your trade
One measure per trade governs; the others are diagnostics. Density means something different when a stop takes 30 seconds than when it takes 90 minutes.
| Trade | Stop shape | Measure that governs |
|---|---|---|
| Residential carts | Seconds per stop, hundreds per day | Stops per hour, with stops per mile as the territory check |
| Commercial dumpsters | Minutes per stop, dozens per day | Stops per hour, revenue per hour as tiebreaker |
| Pump-outs (septic, grease, oil) | 30–120 minutes per stop, a handful per day | Contribution per route-hour |
| Porta-potty service | Minutes per unit, units clustered per site | Units serviced per route-hour |
| Roll-off / hooklift | One can per cycle, each with a disposal leg | Contribution per route-hour, cycles per day as the check |
For scale on the cart end: Route Optimization Consultants cites 180–220 carts per hour as efficient automated residential collection, with 120 stops per hour as a possible manual figure under a 30-second-stop assumption, and Route Optimization Consultants' SWANA collections-KPI training deck puts efficient eight-hour routes at 800–1,000 automated units per day. Those are consultant benchmarks for curbside residential — useful for cart fleets, meaningless for a vacuum truck. On the pump-out end, Grease Trap Locator's trade guide for grease operators puts 6–10 traps per day and $800–$1,500 daily revenue per truck — an editorial trade estimate, not audited survey data, and the spread inside it is the point: the difference between 6 stops and 10 at the same ticket price is a 60-plus percent revenue swing on identical trucks.
That swing is why stop counts alone mislead in pump-out trades. A day of three 1,500-gallon jobs can out-earn a day of seven small ones. Count contribution per route-hour and the argument settles itself.
Calculate it from one route, tonight
Pull one route's numbers (yesterday's is fine) and run the division. You need four inputs your records already contain: door-to-door hours, completed billable stops, route miles, and the route's billed revenue.
Worked example, with invented numbers to show the mechanics. A vacuum truck leaves the yard at 6:30, returns at 4:30: 10 route-hours. It completed 8 stops. Density: 0.8 stops per route-hour. Say those stops billed $2,400 — $240 per route-hour. Now suppose better sequencing and a smarter disposal slot cut two hours of drive time and the same 8 stops come home in 8 hours: 1.0 stops per hour, $300 per route-hour. Same trucks, same customers, same tickets — a 25% raise, earned entirely between the stops.
Three habits make the number useful instead of decorative. Run it per truck per day, not as a fleet average, because averages bury the one route that needs the fix. Keep the inputs honest: door-to-door hours, disposal loops included. And write it down over weeks, because a single day proves nothing; drift is the signal. Grease fleets can see the trade-specific version of this math here, and the day-count end of it lives in how many grease traps a truck can service in a day.
Why equal-stop routes cost different money
Two routes with the same stop count diverge on four inputs: minutes at the stop, minutes between stops, disposal trips, and what each stop bills. A route is dense when the ratio of billable minutes to total minutes is high; stop count never captures that on its own.
Service duration is the quiet one. Ten sites at 20 minutes each is 3 hours 20 minutes of work; the same ten at 35 minutes is nearly six hours, and the route that "should" fit suddenly doesn't. Measured service times per stop, not one fleet-wide default, are the input that keeps the density number honest, and they come free with the planned-versus-actual habit from capacity-based route planning.
Between-stop drive is the one density work usually targets: tighter territories, fewer crossings, stop order that follows the map instead of the phone log. Disposal trips are the third input, and they belong to the route plan: a disposal return placed mid-corridor costs a fraction of an end-of-day scramble across town, and every avoided extra dump run gives the day back an hour. Revenue mix does the rest: an hour at a $400 stop and an hour at a $150 stop are the same hour on the clock and very different hours on the ledger.
The off-route account: accept, reprice, or decline
Price an off-route request by its incremental cost, not its distance from the office: the extra drive minutes, the service minutes, any disposal impact, against the account's revenue. Then one of three answers applies. Accept when the stop sits on or near a corridor a truck already runs and the math clears comfortably. Reprice when the work is good but the geometry isn't: a satellite surcharge or a flexible service day that lets you fold the stop into a fuller future route. Decline (or waitlist) when the account would drag a route's contribution per hour below what the truck earns without it.
The corridor version is the everyday case. In our grease-density write-up, an operator describes accepting an almost-due stop because it needed only about "10 miles extra driving" along a corridor his truck was already running — a first-party anecdote rather than a benchmark, but exactly the right shape of reasoning: the marginal cost of a corridor stop is small, so modest revenue clears it. The same stop forty minutes off-corridor is a different product and deserves a different price.
Sales feels this rule before dispatch does. A territory that grows corridor-first compounds: each new account shortens the average gap between stops — while a territory that grows wherever the phone rings dilutes itself one satellite at a time. Density is as much a sales discipline as a routing one.
Raising density without breaking the fleet
Density gains are real only if five guardrails hold: missed stops, overtime, pack-out or fill limits, safety, and service quality. Chase stops per hour without watching those and the metric will improve while the operation degrades: routes that finish on paper and miss in the field, or drivers who make the number by rushing what shouldn't be rushed.
The honest scorecard pairs every density number with its guardrails: stops or contribution per route-hour, alongside misses, overtime hours, and how close trucks run to their fill limits. ROC's residential guidance plans routes to 85–90% pack-out and about 30 minutes short of a full day precisely to leave room for the variance that real days produce. The same headroom logic applies to a tank as to a hopper. There is no universal cost per stop to aim at across trades; divide your own route operating cost by your own completed billable stops and improve against that.
Where does the gain come from, mechanically? Tighter stop order and territory, disposal returns placed where they cost least, service days that group neighbors instead of scattering them, and recurring schedules that keep the grouping from decaying. That is routing work, and it is exactly the work DynoRoute automates for fleets that fill up or empty out: routes planned around per-truck fill limits with the disposal return inside the route, recurring service cadences that hold their grouping cycle after cycle, and dispatch analytics that report utilization and route density per truck — so the stops-per-hour number this article taught you to compute shows up on a screen instead of in a Friday spreadsheet session. The contribution math stays yours to run: bring the revenue and cost side over from your own invoicing records, and the hours, miles, and stops side is the part the software keeps honest.
Density is the rare lever that pays without buying a truck or raising a price. If you want the route side of that division kept for you every day, get started with DynoRoute — import your stops, run your routes, and read the per-truck density number tomorrow morning.