Key takeaways
- Route optimization for a waste fleet is four problems: territory design, route balancing, stop sequencing, and same-day replanning. Shortest distance is a fraction of one of them.
- Loads that grow toward a fill limit, disposal returns mid-route, recurring cadence, service side, and vehicle restrictions are what separate waste routing from delivery routing.
- Commercial, roll-off, and liquid-waste work is point-stop routing; dense residential curbside is arc routing. Know which you are before buying software.
- Optimization output is only as good as your stop demand, service times, and cadence data. Clean those before you pay for anything.
- A full truck should be a planned event in the route, with the disposal trip and dump time built into the sequence.
- The only ROI number worth trusting is your own before/after test on the same routes and season, normalized per stop serviced.
- When optimized routes fail in the field, look at inputs and adoption before blaming the algorithm.
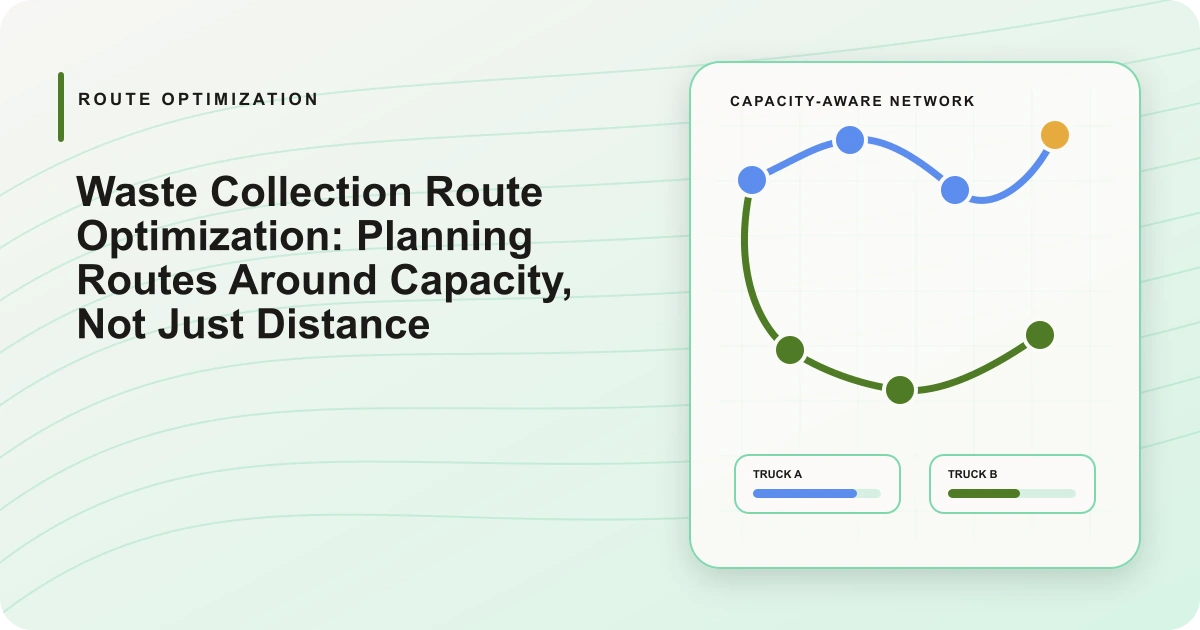
Waste collection route optimization is the planning of a complete collection day: which truck covers which stops, in what order, with disposal returns, time windows, and per-truck fill limits built into the plan before anyone leaves the yard. That is the problem DynoRoute — capacity-based routing for fleets that fill up or empty out — exists to solve, and pricing is public. For a waste fleet that means solving four connected problems — territory design, route balancing, stop sequencing, and same-day replanning — under capacity constraints that run in reverse of delivery's: the load grows toward the fill limit instead of shrinking away, and hitting that limit mid-route means a disposal trip before the day can continue. Shortest drive distance is a small piece of one of those four. A route that ignores when the truck fills up is a route your drivers will abandon by mid-morning, however few miles it shows on paper.
You have probably read a route optimization guide or three that turned out to be delivery-van content with "waste" pasted in. This one starts from the constraint those guides skip: the truck gets full. I build that software, and much of this guide is shaped by operators walking me through exactly where their optimized routes broke.
What route optimization actually solves for a waste fleet
Route optimization for a waste collection fleet is four problems: territory design (which truck owns which area), route balancing (every truck and driver gets a day they can actually finish), stop sequencing (the order of stops within a single route), and same-day replanning (rebuilding the plan when reality edits it). Most software sold as route optimization only does the third.
Territory design moves slowest and hides the most money. A municipal routing practitioner on r/gis describes inheriting a collection network that had not been re-optimized in 20 to 30 years, with roughly 20,000 stops to rework. Territories drift as accounts churn and neighborhoods build out, and a decade of drift leaves trucks crossing each other's paths every day.
Balancing gives every truck and driver a day they can actually finish: hours, volume, and lift counts per truck per day, with route density as the number to watch. RouteSmart, a specialist in municipal waste routing, balances routes by time, by volume, or by lifts — a useful tell for what the industry treats as the real variables. Sequencing is the familiar part: stop order, drive time, dead miles. Replanning is the layer most fleets discover they needed on the morning of their first breakdown.
A guide that defines route optimization as "finding the shortest path through your stops" is describing a slice of layer three.
The constraints that separate waste routing from delivery routing
A delivery route ends when the parcels run out. A waste collection route ends when the truck is full, the scale house closes, or the service window shuts, whichever comes first. Modeling those endings, and the constraints behind them, is the actual job of a waste-grade optimizer.
| Constraint | What the plan must model | Cost of ignoring it |
|---|---|---|
| Vehicle capacity | Projected load after every stop, per truck (gallons, pounds, yards, lifts) | Improvised mid-route dump runs; missed stops |
| Disposal and reload returns | Transfer station, landfill, or treatment-plant trips as stops inside the route | Routes that look short on paper and run long on the road |
| Recurring cadence | Weekly, biweekly, monthly, and on-call patterns planned as one system | One-off replans every week; cadence drift |
| Service side and street rules | Same-side collection, backing limits, restricted turns | Safety exposure; streets passed twice |
| Vehicle restrictions | Bridge weights, height limits, roads a loaded truck can't take | Driver deviations the plan never learns about |
| Time windows | Scale-house hours, business hours, no-service windows | Trucks queuing at a closed gate |
| Material compatibility | What can share a truck, and in what order | Rejected loads; compliance findings |
Two references show where the bar sits. RouteSmart's waste product models same-side collection, backing and turn penalties, and driver fatigue. About Trash's operator routing guide spends most of its length on dead miles, U-turns, and left-turn exposure. Little of that exists in a general delivery optimizer's model. Material rules go further and pull compliance into the route plan itself: what a truck carried this morning constrains what it can legally pick up this afternoon.
Point-stop or arc routing: which model fits your work?
Point-stop routing treats every pickup as a discrete location with its own demand and service time. Arc routing treats whole street segments as the unit of service. Commercial dumpsters, roll-off pulls, septic, grease trap, and used-oil collection are point-stop work; dense residential curbside, where you serve every house on the block anyway, is an arc problem.
The point-stop family is built on the capacitated vehicle routing problem, or CVRP. That is the formal version of a rule every dispatcher already enforces: the demand accumulated on a truck can never exceed what the truck holds. Working out how many grease traps one truck can service in a day is a CVRP question. So is deciding which of 60 scattered septic stops belong to which truck tomorrow.
The test is the shape of your planning question. "Which stops go on which truck, in what order" is point-stop. "How does one truck cover every street in this subdivision without backing up or passing the same block twice" is arc. Arc routing is specialist territory; municipal curbside programs mostly run it in GIS tooling (the r/gis thread above notes that ArcGIS Pro ships a waste-collection VRP solver), while commercial routing software is generally built point-stop. Buying a point-stop tool for a curbside residential operation, or a GIS arc suite for a scattered-stop liquid-waste fleet, is the most expensive way to learn the difference.
The data that must be clean before you optimize anything
An optimizer is arithmetic on your data. Feed it wrong inputs and it produces a confident, wrong plan — on schedule, every morning. Before paying for any software, make seven kinds of data trustworthy:
- Per-stop demand: expected gallons, yards, pounds, or lifts per visit. An estimate is fine; a blank is not.
- Service duration: time at the stop, measured from your actual days rather than a software default. A 4-minute default on a 12-minute stop quietly wrecks the whole afternoon.
- Cadence: which stops are weekly, biweekly, monthly, on-call. Stale recurrence data plans visits to accounts that canceled in March.
- Truck data: capacity per material, restrictions, home yard.
- Driver data: hours, certifications, which trucks each driver can run.
- Facilities: every disposal site's hours, typical dump time, and cutoffs. A missing 4:30 p.m. scale cutoff invalidates the last two hours of a route.
- Addresses and access: gate codes, locked enclosures, the container behind the building that nobody wrote down.
The bad-data failures that come up again and again: wrong service time, unknown container, stale recurrence, missing disposal cutoff. The unglamorous hour spent cleaning your stop spreadsheet is the highest-return hour of the entire project.
How an optimized route handles a full truck
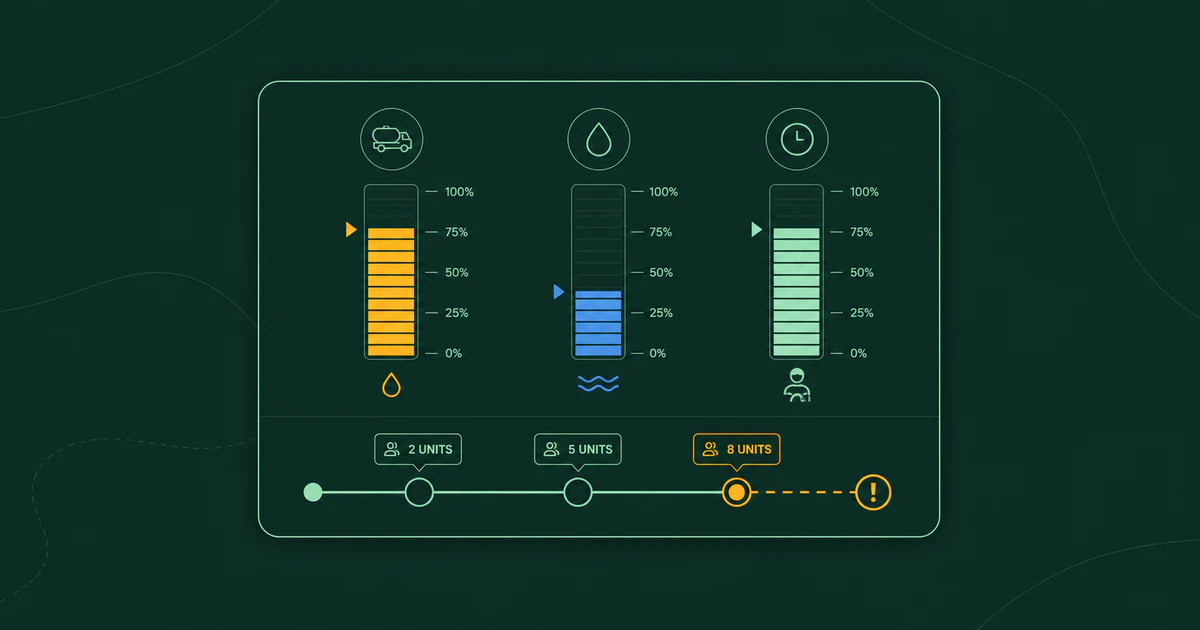
A waste-grade optimizer treats the full truck as a planned event. It projects load stop by stop, and when the next pickup would push past the fill limit, it inserts a disposal trip into the sequence — the drive to the facility, a fixed dumping duration, the drive back — then resumes pickups. HERE's tour-planning model for waste works exactly this way: full vehicle to a reload point, fixed dump time, pickups continue.
Watch three things in how any software does this. Whether the disposal site is chosen against the truck's position or defaults to one fixed facility. Whether the truck's re-entry stop after dumping is re-sequenced or it simply backtracks. And whether a second load is planned as part of the same route rather than bolted on when the driver calls in. Software that handles a full truck by ending the route is delivery software with the logo changed.
This is the piece we hold DynoRoute to hardest. Not the stop order — the disposal return: the trip to the plant and the time at the gate planned into the sequence, and the truck's re-entry stop chosen, before the driver leaves the yard. A dump run you planned costs the drive time it was positioned to cost. A dump run the driver improvises costs whatever the map says, plus every stop that gets bumped behind it.
When the day changes
A route plan built at 6 a.m. usually meets its first edit before 9. Same-day replanning is really a permissions question: what may the optimizer touch? Good replanning inserts new and late work against the capacity trucks still have, reassigns stops after a breakdown, and leaves locked stops and already-serviced stops exactly where they are.
The mechanics worth understanding:
- Dynamic insertion. A callout goes to a truck with room left, within reach, inside the window.
- Cancellation recovery. A canceled stop frees capacity and time; a good replan pulls other work forward instead of banking slack nobody uses.
- Breakdown handling. The dead truck's remaining stops redistribute without pushing other trucks past their own limits.
- Locks and overrides. The dispatcher pins what must not move, and the optimizer plans around the pins.
Infeasibility should come with reasons. When a job won't fit, software that says "no" is useless. Software that says "no — truck 3 is at capacity, and truck 5's window closes before it could arrive" gives the dispatcher something to act on.
Proving the savings without believing a sales claim
The only ROI number that should move your decision is one your own operation generates: the same routes, the same season, before and after, compared per stop serviced. Everything a vendor shows you is an existence proof (evidence that some fleet somewhere achieved it), not a forecast for yours.
The method:
- Baseline. Four to six weeks of current operations: total miles, route hours, disposal trips, missed or redone stops, overtime hours. Divide each by stops serviced. Per-stop normalization matters because stop counts move week to week, and raw totals hide it.
- Holdout if you can. Convert some routes and keep comparable ones on the old plan over the same weeks, so weather and season wash out of the comparison.
- Same season. Comparing a spring baseline with a summer trial mostly measures the season.
- Set the pass threshold before you start, or the result will get argued into whatever someone already wanted it to say.
Here is what the published numbers actually say, with labels attached:
- A peer-reviewed waste collection study modeled a 25% increase in truck capacity and found route-distance reductions of 4.1% to 24.4% across its scenarios. The same paper reports up to 18.2% distance and 41.9% time savings from changes in waste density and collection frequency. These are modeled systems, and the spread is the real lesson: the identical change pays out differently depending on density and disposal distance.
- A separate modeling paper found a 12% fuel reduction at similar travel distance in one case. One modeled case, and a reminder that road physics matter beyond mileage.
- RouteSmart reports a 5% efficiency improvement for Burnaby, BC within six months, and a 37% ($1,083,812) annual operating-cost reduction for Franklin, Tennessee. Vendor-reported customer results.
- An EPA collection-efficiency guide records the Town of Oyster Bay, New York's estimate of $1 million in annual savings from route improvements. A historical government estimate, decades old; treat it as precedent.
Before comparing the vendor numbers, note the units: Burnaby's 5% is an efficiency improvement and Franklin's 37% is an operating-cost reduction — different yardsticks on different baselines, not the ends of one range. Which is exactly why the per-stop test above is the only number that transfers to your fleet.
Two honest gaps in the evidence. You would expect a statistic here on what share of US waste fleets already run optimization software; there is no defensible public number, and an article quoting one precisely is recycling a generic fleet-management stat. There is also no universal cost per stop across residential carts, commercial dumpsters, roll-off, septic, and grease work, so your baseline has to be built from your own labor, truck, fuel, disposal, and overhead figures.
The five numbers to track are the ones already in your baseline: miles, route hours, disposal trips, missed stops, and overtime, each per stop serviced. Price the deltas at your own loaded costs and you have an ROI figure no vendor handed you and none can argue with.
Why optimized routes fail in the field — and what to demand from software
When an optimized route falls apart in the field, the algorithm is the last place to look. Four causes cover most of the failures operators describe: bad inputs, a constraint the model never knew about, navigation a loaded truck can't actually drive, and drivers who never adopted the sequence.
Each has a signature:
- The schedule drifts all morning. Service times are wrong. Re-measure them from real days, per the data list above, and re-plan.
- Drivers keep deviating in the same places. The model is missing a constraint they can see: the left turn that never clears, the school pickup that blocks a gate at 2:50. Deviations are data; feed them back into the plan.
- The sequence is right but the driving is wrong. Sequencing and navigation are different jobs. The optimizer orders the stops; the turn-by-turn your drivers follow in Google, Apple, or Waze has to be sane for a loaded truck. When it isn't, that is a missing road restriction in the plan, not a driver problem.
- The plan decays silently over weeks. Drivers are running their own order. Timestamped, geotagged proof of service shows planned-versus-actual sequence, and that gap is where the adoption conversation starts.
Fold all of this together and the shopping list writes itself. Demand per-truck fill limits as first-class inputs (gallons, pounds, cubic yards, container slots). Disposal returns planned inside the route. Recurring cadence built once and planned automatically. Same-day replanning that respects locks and consumed capacity, with reasons when a job won't fit. A driver app with photo proof of service. CSV import, so the cleaned spreadsheet loads in minutes. Utilization and route-density analytics, so the before/after test runs on the software's own numbers. And if you run curbside residential collection, arc-routing support, which usually means specialist municipal tooling.
That list is what DynoRoute is built to be for point-stop fleets: capacity-based routing with per-truck fill limits, disposal returns planned into the route, recurring schedules, an AI dispatcher that matches jobs to trucks with confidence scores and catches conflicts before they reach the schedule, replanning agents for cancellations and late-running jobs, photo proof from the driver app, a live dispatch map, and dispatch analytics. Navigation stays in the apps your drivers already trust.
Frequently asked questions
What is waste collection route optimization?
It is the planning of a complete collection day — which truck covers which stops, in what order — with disposal returns, time windows, and per-truck fill limits built in before anyone leaves the yard. For a waste fleet it spans four connected problems: territory design, route balancing, stop sequencing, and same-day replanning.
How is waste collection routing different from delivery routing?
The load runs in reverse: a delivery van empties as the day goes on, a collection truck fills. A waste route ends when the truck is full, the scale house closes, or the service window shuts — so the plan has to model disposal returns, recurring cadence, service side, vehicle restrictions, and material compatibility, not just drive distance.
Do I need point-stop or arc routing?
Commercial dumpsters, roll-off pulls, septic, grease trap, and used-oil collection are point-stop work: discrete stops with their own demand and service times. Dense residential curbside, where you serve every house on the block anyway, is an arc problem and usually lives in specialist municipal tooling. Buy for the shape of your planning question.
How much does route optimization actually save?
Published results range from modeled route-distance reductions of 4.1% to 24.4% in a peer-reviewed study to vendor-reported outcomes like a 5% efficiency improvement and a separate 37% operating-cost reduction — different yardsticks on different baselines. The only number that transfers is your own before/after test on the same routes and season, normalized per stop serviced.
Why do optimized routes fall apart in the field?
The algorithm is the last place to look. Most failures trace to bad inputs, a constraint the model never knew about, navigation a loaded truck can't actually drive, or drivers who never adopted the sequence — each has its own signature and its own fix.
If your dispatcher is still carrying the capacity math in their head, get started with your current stop spreadsheet. The import exists so that the data cleanup pays off the same week.