Key takeaways
- A cooking oil collection route starts with a selection decision, because not every container holds enough oil to justify a stop every cycle.
- You can estimate how full a container is without sensors by working from the last measured pickup first, then the account's type and season, then a conservative band for what you still don't know.
- A planned route has to stay inside the truck's usable capacity, which means subtracting residual oil and a safety buffer and building the depot return into the route itself.
- The strongest route is the one that earns the most contribution per truck-hour after rebates and collection costs, and it is often not the shortest one.
- Every pickup should leave a record of measured quantity, time, place, and destination, because the value of the load depends on what you can document.
- Each completed route produces the per-stop actuals that make next cycle's estimates sharper.
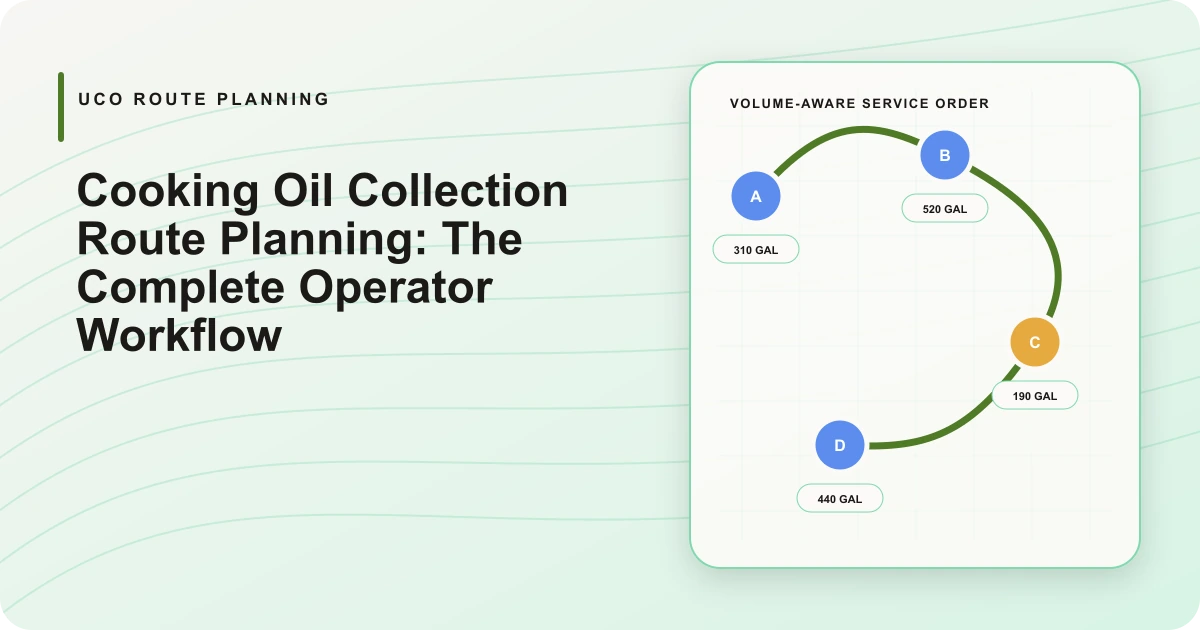
Used cooking oil routes break when they are planned like delivery routes. A delivery route visits every stop on the list and only asks in what order. I build DynoRoute, routing and dispatch software for fleets whose trucks fill up as they work, used cooking oil collection software included — pricing is public — and I have spent much of this year interviewing the operators who run these routes; where the numbers below are illustrative rather than sourced, I say so. A UCO route has to answer a harder question first: which containers are worth visiting at all this cycle? Oil accumulates at a different speed behind every restaurant, and a stop that yields, say, fifteen gallons can cost more in drive time than the oil brings back. So the planning sequence runs: select the containers that are ready, estimate what each will yield, build a capacity-feasible route with the depot return planned in, and rank the result by what it earns per truck-hour.
The academic reference point here is a 2013 paper in Waste Management, "Planning waste cooking oil collection systems", which formalizes the core tension: collection cost can swallow the value of the oil unless you choose deliberately which containers to serve and from where. What the research never provides is the operator's version, from "who gets serviced this week" to the reconciliation at the depot. That is what this guide covers.
Which containers deserve a pickup this cycle?
Selection is a per-cycle decision: out of every account you hold, which containers get a truck this week? Routing researchers call this an inventory routing problem, meaning the schedule is driven by how much product has accumulated at each location rather than by a fixed visiting order.
In practice, a container earns its place on this cycle's route when it clears four checks:
- There is enough oil in it to cover the cost of the stop, based on your best estimate of fill.
- It is approaching the latest date you can safely leave it, whether that limit comes from overflow risk, odor complaints, or a contracted service promise.
- The truck can actually get to it during the site's access window, with the keys, gate codes, or dock timing the site requires.
- Skipping it wouldn't break a commitment; a contracted biweekly account gets serviced on schedule even in a slow fryer month.
Run these checks and the stop list gets shorter while gallons per stop climb: truck-hours stop going to courtesy visits and start going to the accounts that fill fast.
Estimating readiness when accounts have no sensors
You do not need fill sensors to run selective routes. You need an honest estimate for every container, and the estimate improves in three tiers depending on what you know.
| What you have on the account | How to estimate readiness |
|---|---|
| Two or more measured pickups | Divide gallons collected by days between visits to get a fill rate, then project it forward from the last service date. |
| A new account with no history | Start from the account type and fryer count, then adjust for season. |
| Only the container size | Assume a conservative band, plan truck capacity against its high end, and plan revenue against its low end. |
The last measured pickup is the strongest signal you own. Two data points give you a fill rate; five or six start to show a curve, including the weekly rhythm of a busy fry program. Account type carries you until then: a fried-chicken operation and a café with one small fryer are different animals, and a beach-town account in July is not the same account in February. A management framework for UCO collection published in Interciencia proposed triggering pickup alerts at around 75% of container capacity to create a workable collection window. That is a sensible target to plan toward, though it was a research proposal for sensor-equipped containers, not an industry standard. The same paper flags the honest limitation: seasonal swings cut forecast accuracy, and reliable production statistics need long histories.
If some of your accounts carry third-party fill sensors, fold their live readings in as the top tier of the hierarchy. The point of the method is that it keeps working for the majority of accounts that never will.
Uncertainty is a reason to write the estimate as a band and treat the two ends differently: the high end protects your truck from filling early, the low end protects your revenue plan from disappointment.
Keeping the route inside the truck's real capacity
A route is feasible only when the gallons you expect to collect stay under the gallons the tank can actually take, and that is never the number painted on the spec sheet. The working constraint is route gallons ≤ usable truck gallons − residual left in the tank − safety buffer. Residual is whatever came back from the last shift or didn't fully drain at the depot. The buffer exists because your stop estimates are bands, and one hot account can run a hundred gallons over — an invented magnitude; size the buffer from your own logged overruns, not a borrowed rule of thumb.
Walk the route in stop order and accumulate expected gallons. The moment the running total crosses your usable ceiling, the depot or offload stop goes into the plan at that point, and the route continues after it. A mid-route return that is planned costs you a known number of minutes. The same return improvised at 11am costs you the afternoon, because the driver reroutes on the fly and the remaining stops get whatever sequence panic produces.
Here is the arithmetic, with illustrative numbers. A common outdoor container size is 330 gallons; DAR PRO's Cleanstar 2500, for example, is rated at 2,475 lbs, or 330 gallons, which works out to 7.5 pounds per gallon, a useful conversion between pound-based prices and gallon-based tanks. Suppose you service containers when you estimate them around three-quarters full, the same window the research framework above aims at. A 330-gallon container at that level holds roughly 247 gallons on paper, and less in practice once dead space and measurement error take their share. Four of those stops put about 990 expected gallons on the truck. If your usable capacity is 1,000 gallons, you are betting the day on a 10-gallon margin across four estimates, which is no margin at all. Either the depot return goes in after stop three, or the fourth stop moves to another route.
Capacity is only one of the two ceilings a UCO route can hit; the clock is the other, and whichever binds first sets your stop count. The math for translating both ceilings into a realistic stops-per-route number is worked through in our guide to how many restaurant stops fit on a UCO route, so I won't repeat it here.
Rank competing routes by contribution per truck-hour
Once you can build feasible routes, you will usually have more than one candidate for the day, and the shortest one is rarely the most profitable one. Distance is a cost input, not a ranking. What ranks routes is what each stop actually contributes, summed and divided by the hours the route consumes.
Per stop, the math starts with gross stop value = net collectible pounds × market or contract price. Net collectible means measured pounds minus the water and solids your buyer will deduct. From there, stop contribution = gross stop value − restaurant rebate − incremental collection cost − expected quality loss. The rebate is whatever you pay the restaurant for its oil. Incremental collection cost is the extra minutes and miles this particular stop adds to the route, not an average. Quality loss covers the deductions buyers take for moisture, impurities, and free fatty acid levels when a load grades poorly.
The price input moves more than most operators plan for. In the USDA's July 2026 Monthly National Animal By-Product Feedstuff Report, regional asks for yellow grease (the commodity grade UCO trades as) ranged from 53 to 73 cents per pound depending on region and terms, while the year-ago figures on the same rows sat in the mid-30s to mid-40s. That is a market that nearly doubled in a year, riding the demand for UCO as a renewable fuel feedstock. Any spreadsheet with a fixed price assumption is quietly wrong within a quarter, so recheck the current report before you re-rank accounts.
Even vendors selling software into this niche concede the point: Smart Service's cooking oil page notes that a full truck route can still lose money when drivers burn hours collecting low-volume stops spread across town. A full tank feels like a good day; whether it actually was depends on how many truck-hours the tank took to fill, which is why the ranking metric is contribution per truck-hour, with depot time included.
Keep quantity and provenance records attached to the route
Every gallon you collect is worth what you can prove about it. A pickup record that survives scrutiny carries the container or account identity, the measured quantity, the time and place of collection, the driver, and the load's destination. That chain settles three arguments before they start: the buyer's deduction on a graded load, the restaurant's question about its rebate, and any dispute about whether a container was serviced at all.
There is also a downstream reason: buyers selling into renewable fuel markets increasingly ask where oil came from, so a documented load has a wider set of buyers than an undocumented one. This takes no special machinery, just a record per stop, captured at the stop, with weights or gallons the driver actually measured rather than reconstructed at the depot. The practical methods, from dip readings to photographed meter tickets, are covered in our guide to UCO pickup proof and weights.
The depot closes the loop. Reconcile what the meter says came off the truck against the sum of the stop records. Small gaps are measurement noise; recurring gaps in one direction are a process problem worth chasing.
Turn this cycle's actuals into next cycle's plan
Nothing improves next cycle's plan like the route you just ran. Every completed stop hands you a measured actual to set against the estimate you planned with, and the comparison earns its keep in several places at once.
Each actual updates the account's gallons-per-day figure, which makes the top tier of the estimate hierarchy sharper every cycle. The same actuals justify stretching the interval on an account that keeps coming in light and tightening it on one that keeps running near its trigger. Drivers' real on-site minutes, logged stop by stop, quietly turn your time budget from a guess into a plan. And when one account repeatedly lands far under forecast, something changed: a bad estimate, a changed menu, a new fryer-oil contract, or someone else's pump. Sorting theft from forecast error is its own diagnostic, and we cover it in used cooking oil theft prevention.
Recalibration is planning-desk work. It does not cover the day itself, when a truck goes down at 9am or a surprise stop request lands mid-route. Those calls belong to dispatch, and we walk through their logic in dispatching UCO collection trucks.
Running the whole workflow in one system
Most fleets run this workflow in a spreadsheet plus the dispatcher's memory, and that holds up until the account list grows past what either can carry. We built DynoRoute to hold it in one place. Recurring schedules carry each account's service cadence, so the selection step starts from cycles instead of a blank list. Per-truck fill limits keep every planned route inside usable capacity, with depot returns built into the route rather than improvised. The AI dispatcher matches the day's stops to trucks and drivers, scores its confidence on each recommendation, and flags conflicts before they reach the schedule. On the route, the driver app attaches timestamped, geotagged photo proof to every stop, and per-stop records with custom fields hold the measured gallons your recalibration depends on. Your account list comes in by CSV import, and dispatch analytics show route density per truck and how fully each truck is being used. The readiness estimates and the contribution ranking stay your math — or the work of an agent you set up in DynoRoute to run against those records — and either way, the per-stop actuals they depend on get captured once, at the stop.
If your routes are still planned around distance while your margins are decided by capacity and readiness, tell us what your fleet hauls and how your cycles run, and plan next cycle around what the truck can hold.