Key takeaways
- No audited US standard exists for how many restaurant stops a used cooking oil route runs in a day, so any flat number quoted without your fleet's inputs is a guess.
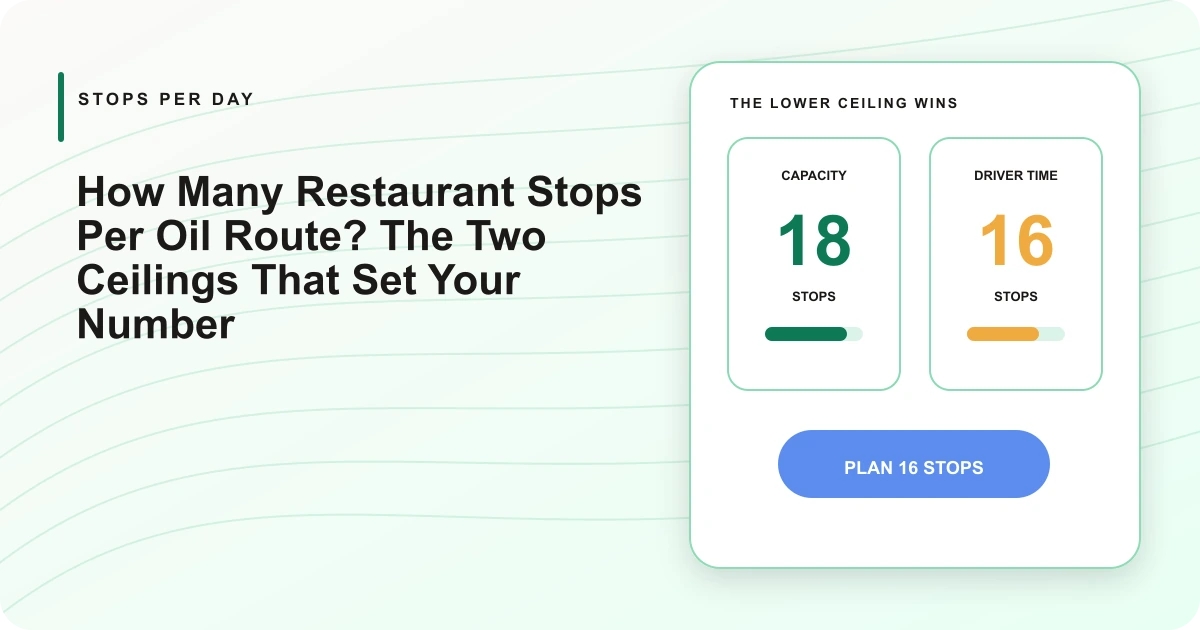
- Your real stop count is the smaller of two ceilings: how many pickups fit in the tank, and how many fit in the route day's minutes.
- Most operators assume the tank sets the limit, but once on-site time, drive time, and offload are added up, the clock usually binds first.
- Gallons per stop should come from each account's pickup history, because container size only sets the most a stop could possibly yield.
- Time per stop is really five smaller clocks covering access, hose, pump, proof, and cleanup, plus the drive, and each one is worth measuring separately.
- Offload is a stop too, and its depot travel, queue, and unload minutes can cut a route day in two when the plan pretends they are free.
- Thirty days of per-stop timestamps and actual gallons gives you a percentile benchmark that beats any industry average you will find online.
How many restaurant stops fit in one oil route? The honest answer is the smaller of two numbers you compute, not one you look up: a volume ceiling set by what the truck holds, and a time ceiling set by the minutes in the route day. Holding both ceilings in one plan is the job DynoRoute's capacity-based routing for UCO fleets does, and pricing is public. Run common container sizes and realistic service times through that math and the worked days below land between roughly 15 and 30 stops — an illustration to test your own numbers against, not an industry standard — with the clock deciding far more often than the tank. Choosing which pickups deserve those slots is a dispatch question; the ceilings themselves are the same arithmetic every fleet whose trucks fill up mid-route runs.
If you searched this exact question, you saw the problem: Google mostly reads "oil route" as a road trip and serves truck-stop travel guides, and there is no audited US benchmark a serious answer could lean on. I build route planning software for collection fleets, and when UCO operators ask me for the number, I walk them through the two-ceiling math instead, because the answer comes from their trucks, containers, and territory rather than an average. By the end you can compute your own stops per day, spot when offload splits the day in two, and start the 30-day log that replaces guessing.
How many restaurant stops fit in one oil-route day?
A truck's feasible day is the smaller of two ceilings. The volume ceiling asks how many pickups fit in the tank: volume ceiling = (usable truck gallons − starting load − buffer) ÷ expected gallons per stop. The time ceiling asks how many fit in the day: time ceiling = available route minutes ÷ (minutes on site + minutes between stops + offload minutes per stop). Compute both and plan to the smaller one.
An illustrative example makes the point. Say a truck has 2,000 usable gallons, you hold back a 10% buffer for forecast error, and your accounts average 45 gallons a pickup: 1,800 ÷ 45 gives you 40 stops by volume. Now run the clock on those same stops at 12 minutes on site and 10 minutes of driving between them. Forty stops need 880 minutes: 14.7 hours of continuous collecting with no offload, no fuel, and no lunch, and no crew runs that. Cap the route at 20 stops and it takes 440 minutes, about 7.3 hours, which fits a real shift once the depot run and morning checks are added. The tank said 40. The day said 20.
Most operators plan from the tank because it is the one number painted on a spec sheet, while the clock hides in dozens of small delays nobody writes down. So when a route day disappoints, the instinct is to blame the routing or wish for a bigger truck; more often the on-site minutes were the ceiling that bound, and a bigger tank would have changed nothing. The rest of this page builds the two estimates separately: gallons first, minutes second.
What counts as one stop?
Count service visits, not addresses, and settle the definition before you measure anything. A restaurant with, say, three 110-gallon containers behind one gate parks once, signs once, and pumps three times. If your history logs that site the same way as a single-barrel account, your minutes-per-stop and gallons-per-stop averages both run high, and both ceilings inherit the distortion. The workable rule is to count the site as one stop for access and proof, and count gallons and pump minutes per container. Whichever rule you pick, apply it in plan and history alike, or the benchmark you build later will disagree with the routes you run.
How do you estimate gallons per stop?
Use each account's pickup history, and let container size serve only as the ceiling on the estimate. The industry's own equipment lineups show how wide that ceiling runs: G.A. Wintzer's outdoor containers span a 55-gallon single-barrel cabinet to a 280-gallon container, DuraCast's collector tanks run 80 to 325 gallons, and DAR PRO's Cleanstar 2500 holds 330 gallons, rated at 2,475 pounds of oil. What a stop will actually yield is a different number, because fill pace swings wildly between kitchens: FoxInsights, writing for collectors, notes that a busy kitchen can fill a container in a few days while a seasonal venue might take six months. That spread is the argument: when fill pace varies that much, no fleet-wide average survives a real route list.
Your own records close the spread within a few services. A bin that yielded, say, 60, 58, and 65 gallons on a three-week cadence is a solved forecast, and no spec sheet competes with it. New accounts get a conservative fraction of container size until they have a record. The renderers work the same way: Wintzer tells customers it will set up service based on usage, with extra pickups on request. Expected gallons per stop is the denominator of the volume ceiling, so a sloppy estimate inflates or starves the whole day.
How do you estimate minutes per stop?
Break the stop into five clocks and time them separately: access, hose, pump, proof, and cleanup. Access is parking, gates, and reaching the container; it varies more by site than anything else. Hose is the run and rig to the tank. Pump time is gallons divided by your equipment's real-world rate. No published source supports a standard pump time for UCO, so the only honest figure comes from timing your own trucks, cold mornings included; anyone who has pumped January oil knows it moves slower than July's. Proof is photos, the ticket, and the gallons entry. Cleanup is lids, spills, and locks.
Drive time sits outside the stop but inside the time ceiling, and it depends on route density rather than effort. The 12-minute on-site figure in the example above is an illustration: your alley-access urban accounts and your strip-mall dock accounts will produce different numbers, which is why the benchmark section below segments them instead of averaging across them.
When does offload cut the day in two?
Offload becomes a second trip the moment the gallons you expect to collect exceed the truck's usable tank, and the plan has to carry its full cost: depot travel, any queue, the unload, paperwork, and the drive back to the route. There are two honest ways to model it. When one end-of-day offload covers the route, allocate its minutes across stops inside the time ceiling, as the formula above does. When collections outrun the tank mid-day, model the depot return as its own leg with its own minutes, because a mid-day offload drags the truck away from the route's geography, a repositioning cost that belongs in the plan. The same second-trip test runs in every collection trade, and the general method is covered in route planning with disposal stops.
How often offload arrives depends on the truck. Equipment in this trade spans box trucks hauling drums up to the 7,000-gallon stainless trailer Coastal runs for its largest customers; the 20-stop, 900-gallon day in the example above would barely register on that trailer and would send a small box truck to the depot twice.
What makes the plan miss?
The exceptions that wreck clean plans each land on one of the two ceilings, and knowing which one tells you where to hold buffer. Extra jugs cost minutes. In a recent r/KitchenConfidential thread, a former rendering-company driver described accounts that let jugs pile up beside the barrels between monthly pickups; he would empty the containers, then hand-dump each jug, often taking "a ton of my route time". Another commenter compressed it to "scoped for one barrel, not a room full of jugs." A locked gate or a blocked alley costs minutes the same way, turning a 12-minute stop into a callback.
Theft costs gallons: a bin that was pumped overnight yields nothing, the volume forecast misses, and the route wasted a slot; the collector-side response is covered in used cooking oil theft prevention. Contamination costs both, because water and solids pump slowly and shrink the value of what you carried. Multi-container growth is the quiet one: an account adds a second tank without telling dispatch, and every estimate attached to that stop goes stale. A plan that holds buffer for these, in the volume formula and in the day's minutes, fails less often.
How do you build your own benchmark?
No US collector publishes an audited stops-per-day standard; the benchmark that matters is the one your fleet writes for itself. The method takes 30 days and four fields per stop: arrival and departure timestamps, actual gallons collected, container size and count, and a short access note. The trucks already visit the stops; instrumenting is just making each visit leave a record, and the same records also settle rebate and weight disputes at month-end.
Read the results as percentiles, not averages. The median minutes-per-stop is your planning number; the 80th or 90th percentile is your risk number, the kind of slow day that shows up a few times a month; and the gap between them tells you how much buffer the time ceiling needs. Segment before you trust anything: alley access against dock access, single containers against multi-tank sites, urban density against highway spacing. A single fleet-wide average hides exactly the variation that decides whether tomorrow's 20-stop plan finishes at 4 p.m. or at 7. Rebuild the numbers each season, because fryer volume, daylight, and cold-oil pump rates all drift, and a benchmark built in March will mislead a January plan.
Build the ceilings into the routing
Everything above runs in a spreadsheet once. The harder part is keeping it enforced on mornings when trucks swap routes, accounts get added, and nobody re-plans the depot return. That enforcement is what DynoRoute is built around: per-truck fill limits hold the volume ceiling so a route cannot be assigned past the tank, depot returns are planned inside the route instead of improvised, and each stop carries its expected gallons and container details in custom fields. The driver app's timestamped, geotagged photo proof stamps every arrival and departure, and per-stop records hold the actual gallons drivers log, so the 30-day log this page describes builds itself while the trucks work — the percentile math on top of it stays yours. Dispatch analytics turn those records into per-truck density and utilization on one screen, and recurring schedules hold each account's cadence without a rebuild every cycle.
If your stops-per-day number is currently a guess, get started with DynoRoute; the first 30 days of routes will hand you the per-stop records the benchmark this page describes is built from.